
Performance Monitoring Metrics You Need To Track For Mobile Apps
Developing and launching a mobile app is only the first step in the long road to creating a mobile app that is high performing. Many users expect a new app to be released but are left frustrated as needs are not met. Due to a lack of value, poor usability, flawed design, and many other common pitfalls, the app market is flooded with products that fail to meet user expectations. To prevent such oversights, analyzing in-app insights that can expose customer interaction trends is crucial, so you can take actionable actions to improve the overall user experience.
Key performance indicators can help you assess your app's success and goes way beyond vanity indicators, such as download numbers. Although the number of installs and installations will assess the value of an app in the marketplace, it does not provide insight into the app's overall commercial performance. This article will illustrate the main mobile app indicators you should be tracking and take actionable measures and achieve your market objectives.
App Functionality Metrics
A brilliant interface and user interaction would make little difference if the efficiency of the software is insufficient. Often there is a strong connection between a decline in usage and bad results. If your software needs basic features, the customers would unhesitatingly leave the app. As a consequence, all other mobile app indicators would be impacted each time the device crashes, lags, or has long load times. For this purpose, to get a detailed understanding of how well the app operates, it is necessary to first monitor both the front-end and back-end features.
The front end metrics that you need to monitor are:
- UI response
- Device compatibility
- Screen rendering times
- Application response time
The backend metrics that you need to monitor are:
- TCP connection times
- Server response time
- Number of HTTP calls
- Time to first byte
Justifiably, performance issues are detrimental to the overall success of any app as they aggravate users, diminishing the user experience. Tracking your app’s performance metrics can help you understand the technical barriers that are damaging the user experience and causing users to drop-off. There are several tools that you can use to track performance metrics such as Crashlytics, Google Analytics, and Xcode.
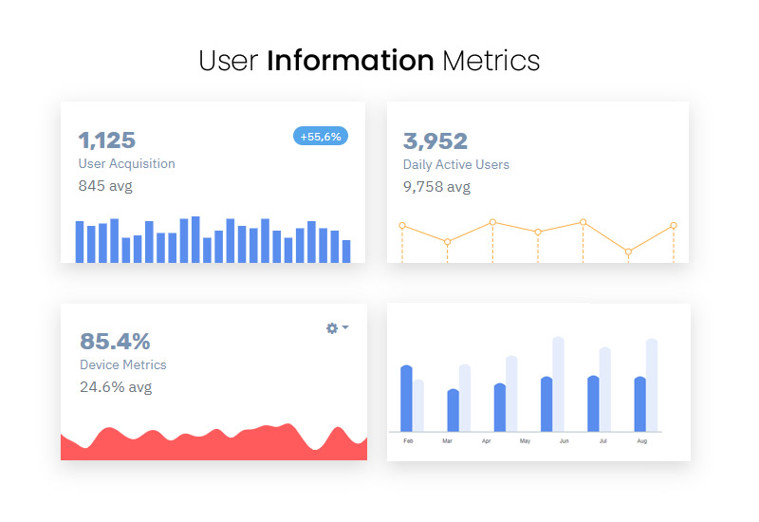
User Information Metrics
Tracking user data is essential to greater engagement. Recognizing your user base will help you understand user monetization behavior, allowing you to track usage, conversions, and ad click-throughs.
User Acquisition
User acquisition measures the number of users who downloaded and installed the app from a particular location, online search, word-of-mouth, paid promotions, in-app recommendations, etc. You would need to monitor user growth correctly and use it as a guide and measure consumer engagement and retention later on.
Daily Active Users (DAUs)
The daily active user is a common statistic showing the number of users that use the app daily. This metric is especially important if your business model is based on ads that need a broad user base to be effective.
Device Metrics
Apps are found on a large range of devices and you need to learn how and when your main consumer base uses the product, and the platforms (smartphones, laptops, etc.). This will help you concentrate your attention so that you can customize your app for any phone or tablet.
User Location
From where are your customers using your app? This data will help you to quickly recognize challenges. For starters, you might start questioning why that happens because you have an app that addresses a wider area but just gets local traction.
Screenflow
Screenflow monitors the movement and cumulative amount of visits between apps, mapping common user experiences inside the app. Examining screen flows would enable you to glance at a given screen and see what behavior people have taken and where they have gone when they exit the app. This will describe the user pain points, barriers to conversion, and drop-off regions.
The gathering of user data will be useful for several purposes, but the biggest advantage of all is that it can guide the development of the mobile app to personalize the user experience. You will decide what functionality users need most, their intention to use the app, and so on, which will guide all user decisions throughout the phase of growth.
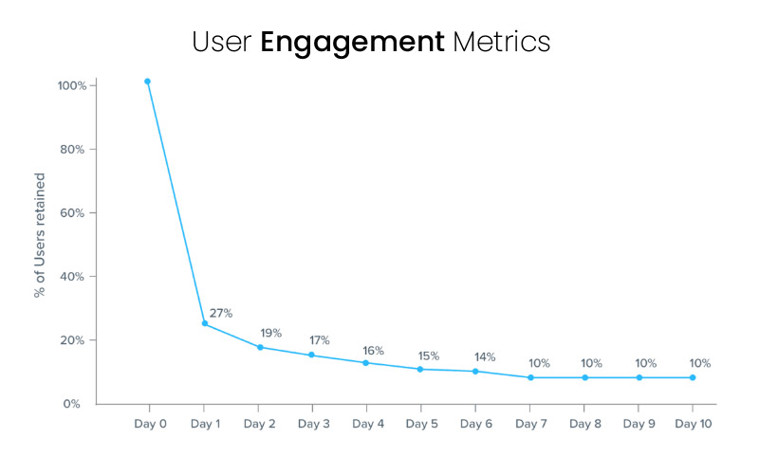
User Engagement Metrics
These metrics help you monitor how users engage with your app. Here are the metrics you need to keep a track of:
Session Duration
Session duration is the period that starts when the user opens the app until the time they close it. Such indicators show how much time your users invest in each session in your app. The more active the users become, the greater the duration of their session. User segmentation may be leveraged to show what apps invest the most time in the app and why.
Measurement of session duration will show areas for development to increase future sales. For eg, measuring this metric for a retail app can expose customer experience holes like a lengthy checkout. If you see users leave their cart when checking out, you may want to decrease the complexity of the checkout phase. This will enable you to make changes and would increase conversion levels naturally.
Session Interval
The session interval is the duration between the first session of the user and the next, demonstrating the frequency of opening the app. Examining the period between sessions will help you improve customer engagement by encouraging frequent usage of the app, increasing the number of users who are involved every day. The measure can show why users never use your app and display interest areas on what encourages them to return.
User Retention
Most applications are only used a couple of times. The primary reason can be due to the lack of interest the app offers to the consumers and another reason could be due to the general bad user experience that they go through when using the app. Both of these factors are leading to the unmet aspirations of consumers. Retention is calculated as the proportion of users returning to the app, depending on their first visit date.
Retention tracking helps you decide what features users like and what is redundant. It is important to create long-term retention to increase conversion levels. To raise LTV and sales, you need to build up a deeply active and invested consumer base that will stay faithful to your device and brand as a whole.
Revenue Metrics
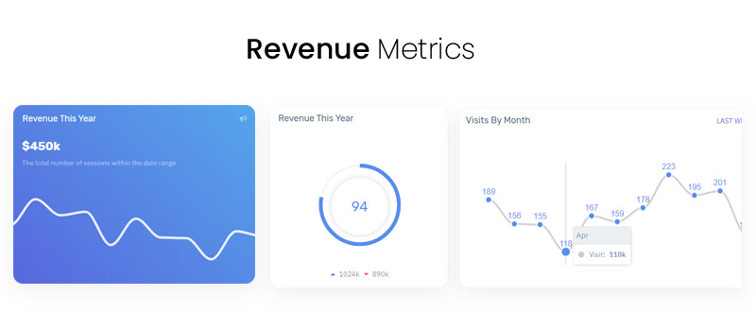
Acquisition Cost
Analyzing your user acquisition metric is an important step in establishing where users come from. But it is equally important to analyze how much it costs each user to acquire. Users are expected to discover your app through a wide range of channels, such as organic search through the App Store, paid ads, and in-app referrals. It is valuable to get the amount of app installs from a certain source, but not as essential as the importance consumers feel as they are immersed in the app experience.
Abandonment Rate
Abandonment rate is the percentage of in-app purchases to abandoned purchases. Transactions may be stopped due to several factors, such as poor performance of the app or the user interface.
Lifetime Value
Lifetime value is a primary income metric, reflecting the app's value and how much each consumer of the app is worth over their lifetime. LTV will show the growth of various user groups over time, which shows how much more you can invest in development to acquire more of these customers and yet make a profit. In the end, you should strive for the LTV to be higher than the cost of consumer acquisition (CAC).
Transaction Revenue
Transaction revenue is the volume of approved purchases from the smartphone device. Although transaction revenue specifically refers to applications that help mobile commerce purchases (shopping, transportation, financial services, etc.), non-commercial applications may also be approximated.
Performance Metrics
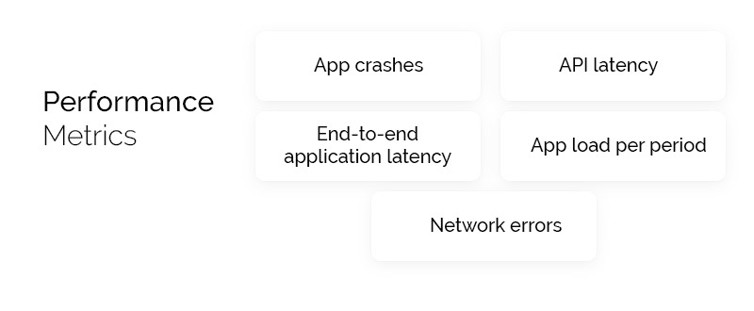
These metrics measure how well the app performs in terms of crashes, delay, latency, loads, etc.
App crashes
Anyone that uses smartphone phones has already encountered crashes. The crash rate is the average crash per-app load. The average crash rate is 1-2 percent, but this differs greatly based on app size, use, sophistication, and so on.
API latency
Today's applications use several APIs or services. Latency refers to the duration of the round trip from request to response. The basic rule of thumb is to reduce the response time to about 1 second or less.
End-to-end application latency
Tracking API latencies isn't just enough; you also need to track the end-to-end response time for applications powering the APIs. Again, the rule of thumb is to maximize the answer time to about 1 second. Users might have some patience for slower response times, but the evidence usually indicates that something above 3-4 seconds overall response period, and the majority of users (60% or higher) may drop the transaction and might even fully uninstall the app.
App load per period
This statistic has to do with the number of transactions or calls over a specified period. It's important because you want to make sure the application performance isn't deteriorating when the load increases. App load can be quite spiky with certain applications, and you need to ensure that your app can manage abrupt shifts in load without slowing down.
Network errors
Usually, network errors are service providers or HTTP errors observed by the app as the device interacts with a networked infrastructure. Network errors may result in crashes or slow answers (multiple retries).
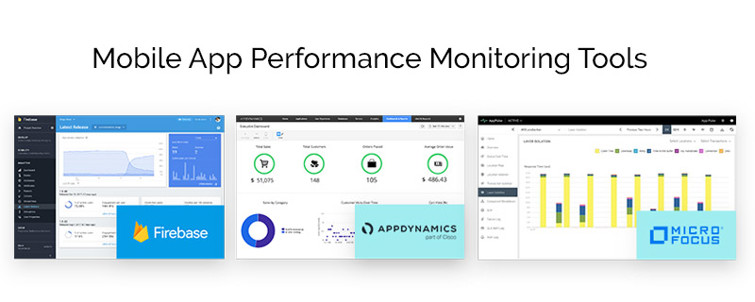
Mobile App Performance Monitoring Tools
With the proliferation of usable apps, smartphone consumers already have very little resistance to badly performing devices. This is not restricted to glitches and crashes because consumers must take into account issues like the speed and battery usage of the device.
According to a Dimensional Research study, 49 percent of consumers anticipate applications to start in 2 seconds or less, and 80 percent will offer three or fewer chances to a badly performing app before uninstalling it. The study also showed that 69 percent of consumers claim negative app impressions weaken their opinions of the ones that developed it.
We will take a peek at some of the best available mobile device performance management (APM) tools. Such apps will help you track not just the failures in your app, but also bugs, errors, network requests, power usage, and more.
Firebase Performance Monitoring
Google provides Firebase Performance Monitoring as part of its Firebase program, to let you keep an eye on how the application performs. Out of the package, Firebase tracks startup time for your app, sluggish or freezing screens, and background and foreground time. You may also set up custom traces inside your device to track different events.
Firebase Performance Monitoring also maintains an eye on the network requests and flags requests or traces that surpass a preset level, automatically. It also monitors attributes such as system, OS, software edition, and memory and CPU use, offering you a glimpse of how your software performs in the wild.
However, this tool only monitors system output and does not allow end-to-end transaction tracking to monitor how the backend is doing.
Platforms: iOS, Android
Price: Free
AppDynamics
AppDynamics is yet another powerful mobile APM solution that enables you to track the performance, errors, crashes, and requests for networks in your app. It records the sessions of your users, logs UI activities, and the time spent in each display, and also takes snapshots to help you understand how users communicate with your program.
AppDynamics will track your network to allow end-to-end transaction tracking and help you find problems that your backend is creating. It also facilitates computational output tracking by simulating end-user actions to proactively uncover issues.
Platforms: iOS, Android, Cordova, Xamarin
Price: Paid
AppPulse Mobile
AppPulse Mobile is a software developed by Micro Focus for smartphone app performance tracking. This tracks bugs, crashes, network requests, and even the power usage in your app.
AppPulse Mobile does not allow you to install tags or make improvements to code, aside from offering end-to-end transaction tracking and control of the backend. It also lets you keep an eye on the overall success of your app, and through their FunDex ranking, concentrate on trouble areas. This is a basic metric that takes into consideration all the bad experiences in your app to measure a metric that lets you appreciate the type of user interface you have.
Platforms: iOS, Android
Price: Paid
Royex Technologies is a mobile app development company based in Dubai. We have worked with more than 300 clients globally since 2013. We have developed over 50 mobile apps of all kinds so we have the skill and expertise to deliver you a quality finished product that will grow your business. For more information please visit our website at www.royex.ae or call us now at +971566027916
About the Author

Rajib Roy
Rajib Roy is the Founder and CEO of Royex Technologies, a leading mobile app, ecommerce development and AI solutions company based in Dubai. With over a decade of experience in digital innovation, his insights bridge technology, marketing, and AI-driven discovery—guiding businesses to build machine-readable ecosystems that drive real growth. A thought leader in AI transformation and digital strategy, Rajib continues to shape how organizations adapt and succeed in the new era of intelligent search.